Google has finally deprecated their GAPI interface which this used to talk to Google Analytics, sorry folks, it will no longer work. See the New Google Analytics for Status Board Server Edition for an updated version.
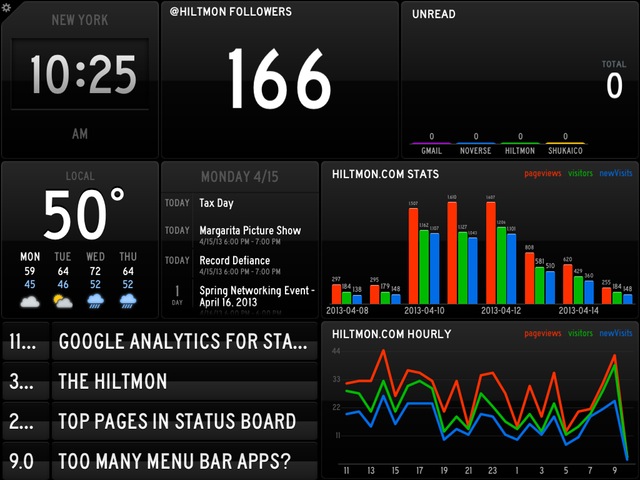
Following up last week’s Google Analytics for Status Board graph and Top Pages table on Status Board, a reader asked for hourly stats instead of daily, so I created it (see the bottom-right graph).
See also Top Pages in Status Board, Daily Stats and OS and Browser Stats.
The script creates a 24-hour rotating window of stats using your local time-zone for reference. Note that I have only tested this in US EST, but it should work elsewhere.
The steps are all the same as Google Analytics for Status Board, so follow along, only replace that script and the launcher files with these.
- Install the
jsonandgatticagems - Configure the script with your own parameters (and optionally change the Google Analytics account using the script at https://gist.github.com/hiltmon/5373934 to get the index and uncomment line 45 to set it).
- Schedule the script to run by modifying the
.plistfile below to reflect your path to the script, then copying it to~/Library/LaunchAgentsand loading it withlaunchctl
The script code is in status_board_hourly.rb:
#!/usr/bin/env ruby

# status_board_hourly.rb
# Hilton Lipschitz
# Twitter/ADN: @hiltmon
# Web: https://hiltmon.com
# Use and modify freely, attribution appreciated
#
# Script to generate @panic status board files for Google Analytics web stats. This one generates a
# line graph for a 24 hour window
#
# Run this regularly to update status board
#
# For how to set up, see https://hiltmon.com/blog/2013/04/10/google-analytics-for-status-board/

# Include the gems needed
require 'rubygems'
require 'gattica'
require 'date'
require 'json'

# Your Settings
google_email   = 'hiltmon@gmail.com'  # Your google login
google_pwd     = 'I_aint_sayin'   # Must be a single use password if 2 factor is set up
the_title      = "Hiltmon.Com Hourly" # The title of the Graph
file_name      = "hiltmonhourly"      # The file name to use (.CSV and .JSON)
dropbox_folder = "/Users/Hiltmon/Dropbox/Data" # The path to a folder on your local DropBox

# Configuration
metrics = ['pageviews', 'visitors', 'newVisits']
colors = ['red', 'green', 'blue']
days_to_get = 7

# Login
ga = Gattica.new({
    :email => google_email,
    :password => google_pwd
})

# Get a list of accounts
accounts = ga.accounts

# Choose the first account
ga.profile_id = accounts.first.profile_id
# ga.profile_id = accounts[1].profile_id # OR second account

# Get the data
data = ga.get({
    :start_date   => (Date.today - 1).to_s.split('T')[0],
    :end_date     => Date.today.to_s.split('T')[0],
    :dimensions   => ['date', 'hour'],
    :metrics      => metrics,
})

# Make the JSON file
graph = Hash.new
graph[:title] = the_title
graph[:type] = 'line'
index = 0
graph[:datasequences] = Array.new

metrics.each do |element|
  sequence = Hash.new
  sequence[:title] = element
  sequence_data = Array.new
  data.to_h['points'].each do |point|
    the_date = Date.parse(point.to_h["dimensions"].first[:date]).to_s.split('T')[0]
    the_hour = point.to_h["dimensions"][1][:hour]
    the_window = DateTime.parse("#{the_date} #{the_hour}:00 #{DateTime.now.strftime("%z")}")
    next if the_window < (DateTime.now - 1)
    next if the_window > DateTime.now
    the_title = the_window.hour.to_s
    the_value = point.to_h["metrics"][index][element.to_sym]
    sequence_data << { :title => the_title, :value => the_value }
  end
  sequence[:datapoints] = sequence_data
  sequence[:color] = colors[index]
  index += 1
  graph[:datasequences] << sequence
end

File.open("#{dropbox_folder}/#{file_name}.json", "w") do |f|
  wrapper = Hash.new
  wrapper[:graph] = graph
  f.write wrapper.to_json
end
Once again, edit the script to change:
- The email and password you use to access Google Analytics.
- The title, file_name and dropbox_path to save the data on your computer and dropbox.
The launcher code is in com.hiltmon.status_board_hourly.plist:
<?xml version="1.0" encoding="UTF-8"?>
<!DOCTYPE plist PUBLIC "-//Apple//DTD PLIST 1.0//EN" "http://www.apple.com/DTDs/PropertyList-1.0.dtd">
<plist version="1.0">
<dict>
    <key>Label</key>
    <string>com.hiltmon.status_board_hourly</string>
    <key>ProgramArguments</key>
    <array>
        <string>/Users/Hiltmon/Dropbox/Scripts/status_board_hourly.rb</string>
    </array>
    <key>StartInterval</key>
    <integer>300</integer>
</dict>
</plist>
Update it too for your paths and names, the copy and load it.
Add it to Status Board
Follow the instructions in Graph Tutorial (PDF):
- Share the JSON file on your DropBox
- Mail that link to yourself
- Tap the link in the email on your iPad to open it in Safari
- Copy the link from Safari (minus the bit after the
?) - Add a new graph to your Status Board and paste in the link (it offers to do this by default).
Enjoy.
Update: All the scripts can be downloaded from Github at https://github.com/hiltmon/status-board-ga.
Follow the author as @hiltmon on Twitter. Mute