When I find some Ruby on Rails or Rake tasks running slowly, I throw a quick and dirty profiler around the suspect code to find the bottlenecks with ease. Here’s how I do it, maybe this approach can help you too.
To profile in Ruby on Rails, add the following to your Gemfile
gem 'ruby-prof'
And don’t forget to run bundle.
Add the following file Gist 1929287 into your lib folder
class DevelopmentProfiler

  def self.prof(file_name)

    RubyProf.start
    yield
    results = RubyProf.stop

    # Print a flat profile to text
    File.open "#{Rails.root}/tmp/performance/#{file_name}-graph.html", 'w' do |file|
      RubyProf::GraphHtmlPrinter.new(results).print(file)
    end

    File.open "#{Rails.root}/tmp/performance/#{file_name}-flat.txt", 'w' do |file|
      # RubyProf::FlatPrinter.new(results).print(file)
      RubyProf::FlatPrinterWithLineNumbers.new(results).print(file)
    end

    File.open "#{Rails.root}/tmp/performance/#{file_name}-stack.html", 'w' do |file|
      RubyProf::CallStackPrinter.new(results).print(file)
    end

  end

end
To use it, just wrap the slow code as follows. Note that the name import is the prefix I want to use on the output files:
DevelopmentProfiler::prof("import") do
	# Your slow code here
end
Next time you call this code, via a URL or in a Rake task, it will be profiled and three files will be written to tmp/performance:
import-flat.txt: A text file listing all functions called, the time spent in each and the number of calls made to that functionimport-graph.html: A HTML page allowing you to see and drill down the call tree to find where the time is spent.import-stack.html: A complex HTML stack page that enables you to visualize the profile.
I use on the import-stack.html file in my quick and dirty approach. Here’s what one of these looks like:
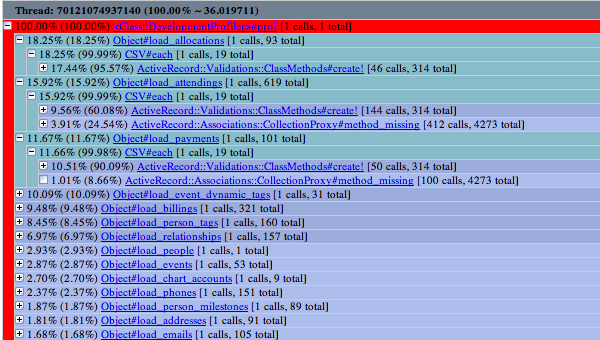
This profile ran for 36.01 seconds, and spent 18.25% of its time in load_allocations. Looks like we can get some improvement there. So I then expand out the tree to see where in my code it spends the time, how many times something gets called, and then choose which to optimize. One of the excellent features of this view is that the links open TextMate at the line of code being profiled.
Iterate, optimize, profile, iterate, optimize, and profile again, and I see this:
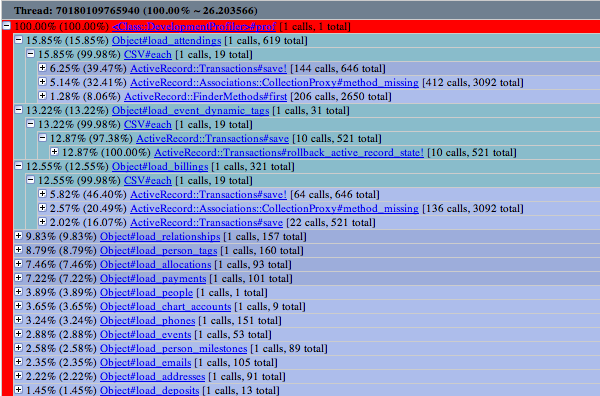
This profile now ran for 26.20 seconds, a huge speed up, with load_allocations using only 7.46% of the shorter runtime. There is much more I can do. I can drill on these stacks for hours finding more and more methods to optimize.
I usually profile like this in the development environment (most people recommend using a profiling or staging environment). This way I have access to my development database as well as the ability to drop in some quick logging or puts methods to help me see what is going on. I did say it was a quick and dirty approach.
So next time you are wondering why something in Rails or a Rake task is slow, just wrap it in the profiler and drill down the stack to see where the slowdown is.